
When a flood event triggers our analysis, we provide you with the following outputs.
Observed flood report
This report arrives within 6 hours of us starting the analysis. It provides an initial picture of the flood’s impact in areas where we’ve observed flooding.
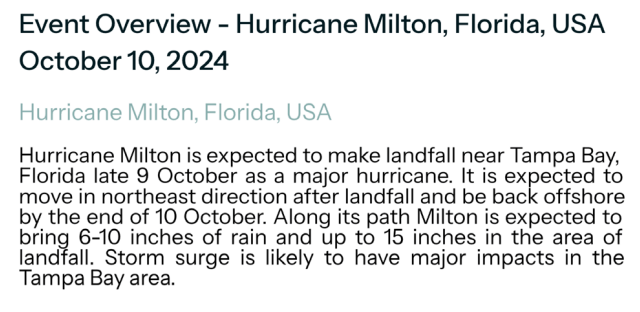
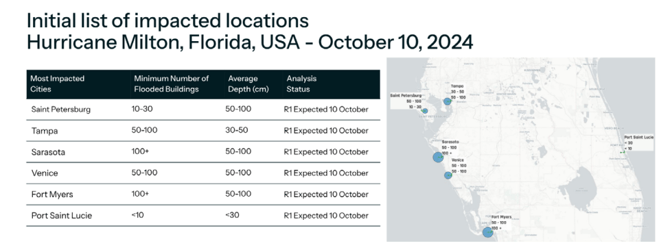
EXHIBIT 3: Examples from an observed flood report
ICEYE Flood Insights release files
When we analyze a flood event, you’ll receive a set of files containing detailed information, all provided in the WGS84 coordinate reference system by default.
Here’s a breakdown of what you get:
Key data files:
- Metadata file (JSON): This file provides an overview of the flood event and additional
information about the data you receive. -
Flood depth raster (GeoTIFF): This is the main data file, containing estimates of flood depth at each location within the flooded area. You can choose to receive depths in centimeters or inches. The horizontal resolution of this file varies depending on the location and underlying data, but it’s typically between 3 and 5 meters per pixel. This horizontal resolution of raster outputs is specified in both the metadata and release notes.
-
Flood extent vector (GeoPackage/GeoJSON): This is a polygon layer that covers the areas identified as flooded by ICEYE. It’s derived from the flood depth raster and allows you to easily see which locations are underwater.
Additional Information:
-
Release notes (GeoPackage/PDF): These notes summarize the data used in the analysis and include any comments from our analysts about the analysis tier in the results for specific areas.
-
Building inundation vector (GeoPackage/GeoJSON): This file (available in limited regions) provides statistics on flood depth for buildings within the flooded area.
Please note that the building inundation vector file is currently available for Japan and US only.