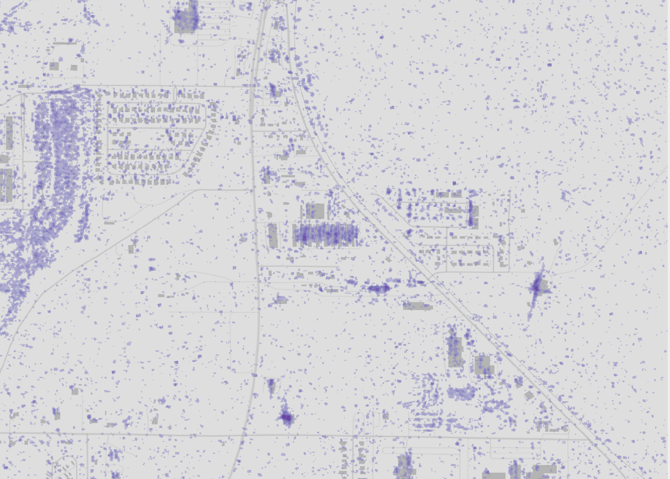
The raster heatmap provides the underlying signal supporting structure-level damage assessment. It highlights areas that experience significant change as a result of the event and which could be damaged based on the change in radar reflection signature measured prior to and immediately after event landfall. Examples of observable damage include partial roof removal, large tree fall on structures, and large areas of structural debris scatter. Damage to individual shingles or cracks in roof are not likely to be detected.
This layer can be used to more closely examine the intensity and distribution of detected changes at the sub-structure level.
Factors leading to false detections
This layer provides change estimates for the entire imaged area and is intended to complement the building-level outputs. It is likely that false positives unrelated to damage are included in the scene in non-structural areas.
- Low lying vegetated areas provide less reliable reflection and can be prone to false positives. Typically, wet soil is the causal factor.
- Riverbanks have been observed to provide false detections and can at points be adjacent to structures.
- Variable occupancy areas e.g., parking lots can be prone to false detections if they are occupied before or after the storm at varying capacity.
Note that we do not consider flooded terrain as false detection and it is usually a common cause behind detections particularly in agricultural regions. To better understand flooding in a given area, ICEYE's Flood Insights Product provides comprehensive extent and depth for most severe events.
File format: Raster (.tif)
Resolution: 1.5m
CRS: EPSG:4326
Cell values: {1-255, 0: No data} Values greater than 0 represent regions of significant change, and in total represent the areas that have undergone the most intense change (by percentile) observed by differencing the pre-post image scenes. Within this range, higher numbers represent more significant changes as a result of the event.
US: Small damages, such as damage to individual shingles or cracks in the roof are not likely to be detected.
Australia: Small damages, such as damage to individual shingles or cracks in the roof are not likely to be detected.
Note: the "File type" label differs between source documents — the US guide lists this as "Raster Damage Heatmap," the Australian guide lists it as "Raster Impact Heat Map."
Image: Raster heatmap (darker colours mean more significant change/damage). Comparison with imaging captured in days just before landfall. This heatmap from Florida during Hurricane Milton indicates possible damage, with some areas of higher damage intensity.