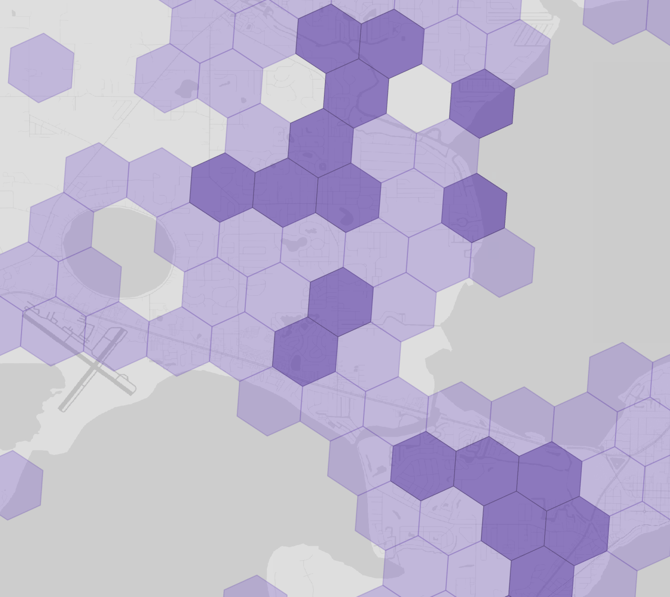
Each feature is a hexagon derived from the H3 spatial index at level 8 resolution, containing aggregate statistics of the buildings damaged within each hexgrid. This layer is designed to allow users to quickly compare the number of damaged buildings across a region. The default presentation for this layer is "damaged_buildings", which provides a holistic view of differences in structure-level damage across the scene.
Attributes
| Attribute | Description |
|---|---|
h3_index |
unique H3 cell identifier (level 8) |
damage_pct |
percentage of buildings within the hex grid classified as "damaged" |
damaged_buildings |
count of buildings classified as "damaged" within the hex grid |
total_buildings |
total number of buildings (damaged + undamaged) contained with the hex grid |
File format: Geopackage (.gpkg)
Resolution: H3 Level 8 (0.74 km², or about the size of a large city park)
CRS: EPSG:4326
Image: Vector Hexgrid Impact Heatmap illustrating the aggregation of likely damaged buildings in the landfall area of Hurricane Milton. This heatmap can be used to compare impacts across regions.