
ICEYE Solution Suite (ISS)
ICEYE provides wildfire monitoring capabilities through two platforms. The ICEYE Solution Suite (ISS) is ICEYE's centralised web platform and the primary monitoring interface going forward. The ArcGIS Wildfire Monitoring Application is currently maintained in parallel and will be available until further notice.
The monitoring capability in ISS gives customers a single, continuously updated view of all wildfire events ICEYE is actively monitoring and analysing, designed to ensure customers always understand which events are being tracked, their current status, and when to expect deliverables.
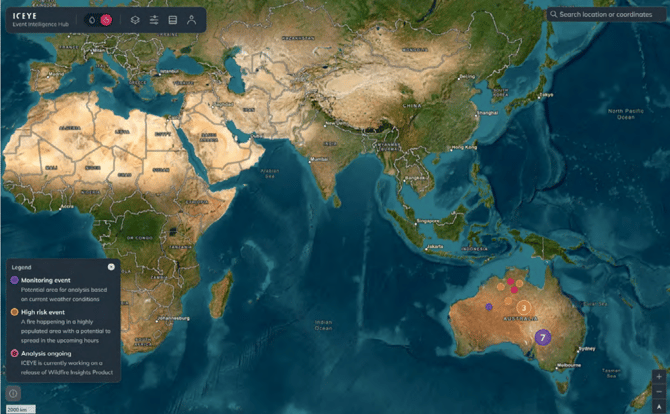
Above: ICEYE Solution Suite (ISS) - Fire Event Map. Active wildfire events are displayed and colour-coded by status: purple = Monitoring event, orange = High risk event, red = Analysis ongoing
Key features
- Fire Event Map: An interactive map displaying all active wildfire events ICEYE is currently monitoring or analysing, colour-coded by status (purple = Monitoring event, orange = High risk event, red = Analysis ongoing).
- Fire Event Table: A structured table view of all active events, including event name, location, start date, and current ICEYE analysis status.
- Event Pages: Each fire event has a dedicated page with further detail, including visualisation of the official fire perimeter (or hotspot-derived perimeter where official data is unavailable).
- Building Damage Assessment Visualization: BDA outputs are visualised directly on the map within each fire event page, colour-coded by classification (likely destroyed / not destroyed), alongside the fire perimeter and hotspot age (0–24h, 24–48h, 48–72h).
- BDA File Download: Files can be downloaded directly from the event page in ISS, no API access or DocSend required, available to all ISS customers with a wildfire subscription.
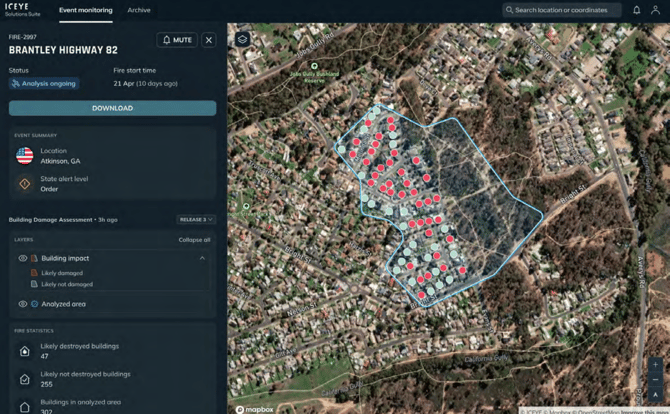
Above: Building Damage Assessment visualization. Map legend showing different layer types
(fire periemeter, hotspot age, likely destroyed/not destroyed buildings)
Event statuses
| Status | Description |
|---|---|
| High risk | The event has passed ICEYE's monitoring threshold. ICEYE is actively tracking the event and assessing whether it meets activation criteria for a Building Damage Assessment. |
| Analysis ongoing | The event has met ICEYE's activation threshold. A Building Damage Assessment is being produced and releases will be delivered to the customer. |
How customers can use ISS
- Situational awareness during an active event: Understand the scope and trajectory of a wildfire in near real-time, including direction of spread, communities in its path, and structures at risk.
- Identifying exposure before a Building Damage Assessment is available: In the hours before a BDA is delivered, the monitoring application shows the number of buildings within the perimeter and surrounding buffer zone.
- Proactive policyholder communication: Identify policyholders located within or near an active fire perimeter and communicate proactively before a formal damage assessment is available.
- Supporting vulnerable communities: Combine building footprint data, urban centre layers, and fire progression information to prioritise outreach and resource mobilisation toward the most at-risk populations.
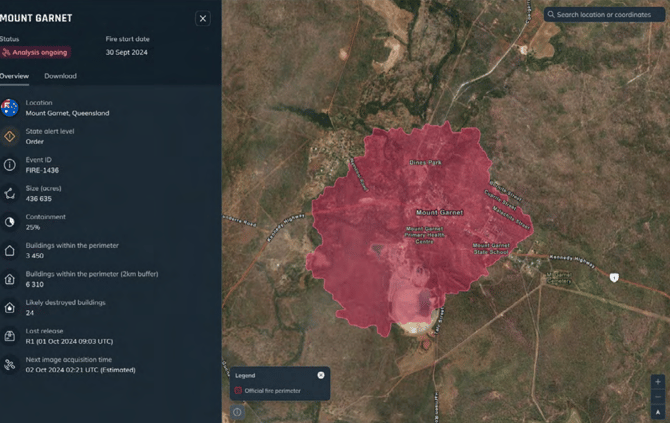
Above: ICEYE Solution Suite (ISS) - Fire Event Page. The Mount Garnet fire event page (QLD, Australia) showing key event details including fire status, size, building exposure, likely destroyed buildings, last release date, and next scheduled image acquisition time.